This post is the first in a three-part series on “Oklahoma’s Unemployment Gap,” examining the persistence of racial disparities in unemployment. Part One introduces the unemployment gap and presents preliminary descriptive data on state labor market trends by race. Part Two explores underlying and immediate causes for the state’s black-white unemployment gap and suggests reasons for its persistence. Part Three evaluates solutions for addressing and closing the gap.

Black unemployment in the United States has reached depression-era levels in the wake of the Great Recession, and some speculate that long-term unemployment is reversing decades of black economic gains. Black unemployment at the state level mirrors the national trend. Oklahoma experienced a comparatively less severe recession and maintains one of the lowest unemployment rates in the country. Yet black workers in the state were unemployed at more than twice the rate (13.1 percent) of white workers (5.9 percent) in 2010. This is comparable to the national gap – where the unemployment rate for black workers is about twice (16.2 percent) that of whites (8 percent). Andy Kroll at Salon.com explains that this entrenched unemployment gap has a puzzling statistical persistence:
The unemployment lines run through history like a pair of train tracks. Since the 1940s, the jobless rate for blacks in America has held remarkably, if grimly, steady at twice the rate for whites. The question why has vexed and divided economists, historians and sociologists for nearly as long.
It’s not only that black workers have a persistently higher jobless rate, they also stay unemployed longer. Oklahoma ranked 2nd in 2004 and 1st in 2007 in average length of black unemployment out of all the states. Black workers were jobless for nearly three times as long (35.1 weeks) on average as white workers (12.2 weeks) in 2007. A gap in the duration of unemployment is particularly insidious because of the dampening effect long-term joblessness has on an applicants’ employment prospects. The rate at which the long-term unemployed find jobs compared to their newly jobless counterparts drops steadily from week to week and the National Employment Law Project recently documented extensive and widespread hiring discrimination against the unemployed.
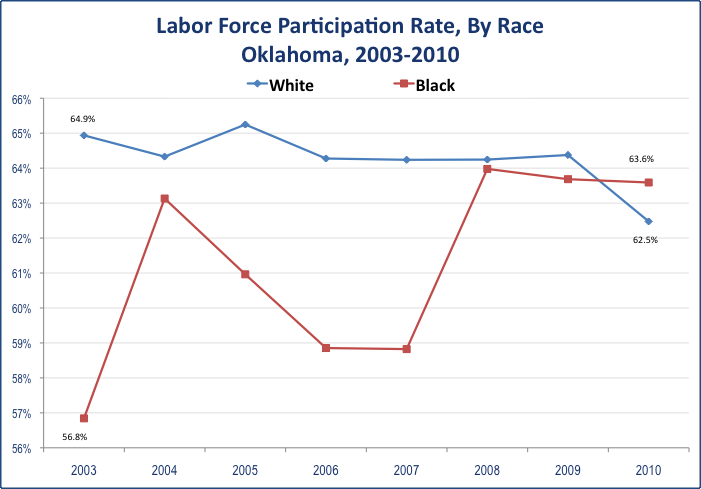
Much of the gap is driven by exceptionally high rates of unemployment among black men; the unemployment rate for black men in Oklahoma is about two and half times that of white men. What accounts for these disparities? It’s certainly not because black Oklahomans are less likely to be looking for work. The black labor force participation rate grew from 56.8 percent in 2003 to 63.6 percent in 2010, surpassing the state’s white labor force participation. The chart below tracks the state’s black-white labor force participation rates from 2003 to 2010:
The labor force participation rate measures the size of the civilian labor force relative to the civilian population. It’s a good measure of the scope of able-bodied working-aged adults’ participation in the labor market. The civilian labor force is inclusive of both the employed and the unemployed, counting adults who have a job or are actively looking for a job. The population not counted in the civilian labor force includes, among others: retired persons living at home, dependent children, students, stay-at-home parents who care for children, adults who stay-at-home to care for sick or disabled relatives, and adults who can work, but for whatever reason are not actively seeking employment.
These data cast the state’s unemployment gap in a starker light. Even as an ever-increasing share of the black population of Oklahoma seeks and secures employment, their unemployment rate relative to the state’s white population remains twice as high. There are also key differences by race in the characteristics of the employed. Black workers were two and half times more likely than whites to report in 2009 that they were working part-time because it was the only employment they could find. By contrast, more white workers reported that they worked less than full-time because they were in school.
Duke University public policy expert William Darity admits, “I don’t know if there’s anybody out there who can tell you why that ratio stays at 2 to 1. It’s a statistical regularity that we don’t have an explanation for.” While there is little expert consensus on the reason for the exact ratio, explanations for the unemployment gap’s persistence abound. The next post in this series, ‘Oklahoma’s Unemployment Gap,’ explores a few of these explanations using state-level data on racial disparities in education and incarceration, as well as Oklahoma’s record of equal opportunity hiring practices.
Click here for part two of this series: Oklahoma’s Unemployment Gap (Part Two): Why the labor market isn’t colorblind


 OKPOLICY.ORG


5 thoughts on “Oklahoma’s Unemployment Gap: The labor market isn’t colorblind”