


OK Policy’s Research Director Anthony Flores shared with lawmakers an overview of poverty in Oklahoma, including defining poverty, showing which residents live in poverty, and what the state can do to address the problem. Flores and OK Policy Fiscal Policy Analyst Aanahita Ervin spoke during an Oct. 10, 2024, interim study in the Oklahoma Senate focused on decreasing poverty in Oklahoma. The following is a transcript of his comments. (Ervin’s comments can be found here.) The full video of the interim study — IS-24-036, Decreasing Poverty in Oklahoma (Sen. Kirt) — can be viewed at the Oklahoma Senate website.
• Watch: via YouTube
• View: Presentation slides (PDF)
• Learn: 2023 Census data: Oklahoma ranks as sixth poorest state
• See also: Aanahita Ervin’s presentation
Comments from Anthony Flores, Research Director for the Oklahoma Policy Institute:
Hello, everyone, and thank you for the opportunity to speak today on such an important topic. My name is Anthony Flores, and I’m the Research Director at the Oklahoma Policy Institute. I’m here to provide a statistical overview of poverty in Oklahoma.
A bit about my background: I hold a master’s degree in economics, and my research focus was on poverty reduction strategies. I hope that by sharing some of this research and insights I’ve gained over the years, we can better understand the challenges facing our communities and consider effective ways to address them.
In this presentation, I’ll address three key questions:
- What is poverty?
- Who is in poverty?
- What can we do to help people move out of poverty?
Given our limited time, I’ll provide a high-level overview of these topics. My goal is to establish a shared understanding of poverty in Oklahoma, so that the upcoming discussions can build on this foundation.
What is Poverty?
Let’s begin with some shared definitions. Understanding these definitions are crucial to understanding poverty. Often, conversations about poverty drift into abstract or philosophical territory, which can cloud our view of the issue and its solutions. Returning to clear definitions helps us stay grounded.
So, what is poverty? Poverty is a lack of resources to meet basic needs. It’s a simple definition but there’s a lot underneath.
In a moment, we’ll go over what we mean by resources and what we mean by basic means.
But first, it’s important to understand that poverty is not determined at the individual level-it’s a household issue. Resources are shared among family members, so either the entire household is in poverty, or none are.
Throughout this presentation, I’ll be using the Census Bureau’s Supplemental Poverty Measure (SPM), which is widely accepted as the most comprehensive way to capture poverty in the U.S. It considers both income, public assistance, and necessary expenses, providing a clearer picture than older measures which only consider pre-tax income. Using the SPM, we find that in 2023, 13.1% of Oklahomans-over 500,000 people-do not have enough resources to meet their basic needs.
What Are Basic Needs?
What do we mean by “basic needs”? In the Census SPM, they include:
- Food
- Clothing
- Shelter
- Utilities (FCSU)
The SPM calculates a poverty line based on what households typically spend on these necessities, adjusted for family size, household type, and geographic differences. That means the poverty line is higher for a household of four than a household of one. And the poverty line is higher in more expensive areas like New York City and lower in places like Oklahoma.
This approach even factors in different living situations, such as owning a home versus renting. It even considers if a household has to pay a mortgage or owns their home outright. It’s a more accurate reflection of the cost of living and what it takes to stay afloat.
How Do We Measure Resources?
A household’s resources add in all cash income and public assistance and subtract out certain unavoidable expenses-by necessary expenses we don’t mean a coffee at Starbucks, we mean things like taxes, transportation, childcare, and medical costs. Things you need to keep your job or stay alive. This is a thorough calculation, giving us a deeper understanding of who falls below the poverty line.
After those adjustments, calculating poverty is straightforward. Every household with resources above their poverty line is not in poverty. Everyone with resources below their poverty line is in poverty.
So if the SPM is so much better why do we still use the Official Poverty Measure (OPM), which only considers income before taxes? Because it requires asking less questions, so you can cheaply get a big sample size, and get good estimates down to the county or even neighborhood level. Or in the case of federal poverty guidelines, because it make figuring out if you’re eligible for a program easier. For example, in 2024, if your household has three people and your income is below $25,820, then you’re in poverty. All I have to ask are two questions. I miss a lot of nuance, but its simple.
So that’s why the numbers can differ. But we use the SPM in this presentation because it offers a more detailed answer to the key questions: who is in poverty and why?
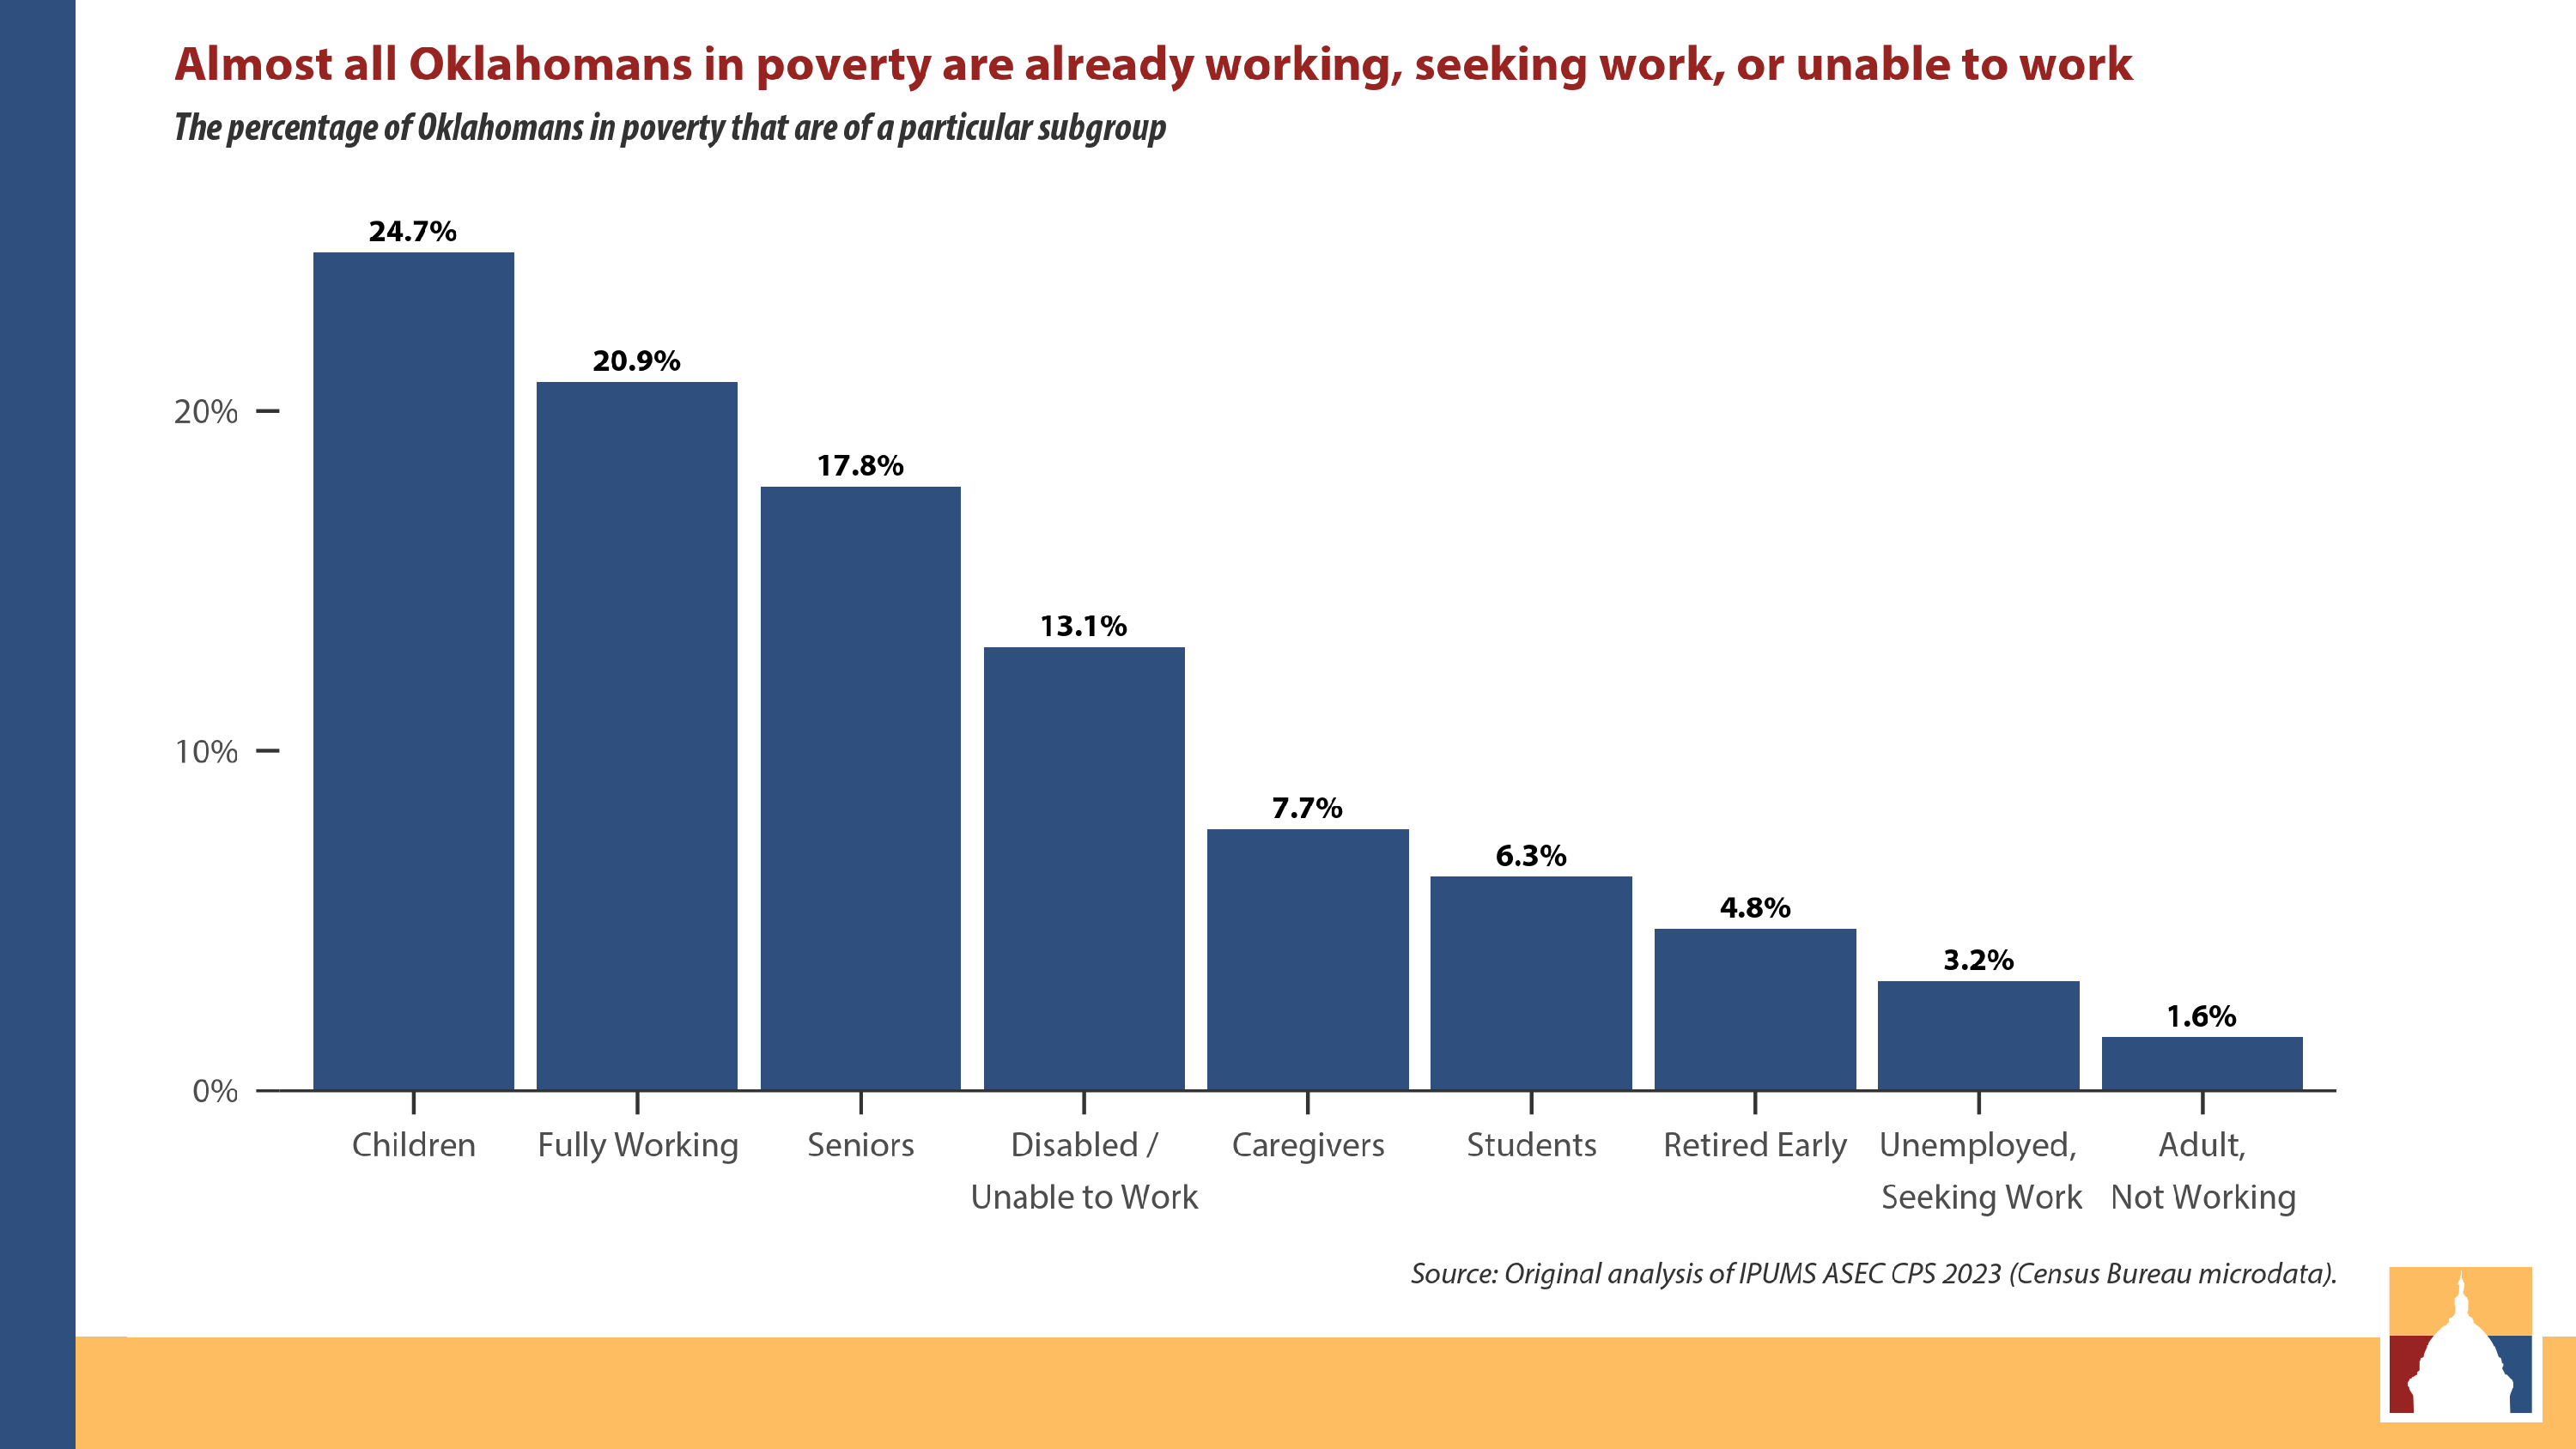
Who is in poverty? When we hear that 13.1% of Oklahomans are in poverty, it’s easy to think of them as a homogenous group. But what shocked me when I began researching poverty was that the image of who was in poverty and the reality were very different. I was given a perception that there is this mass of able-bodied adults sitting on the sidelines and not participating in work. And that these are the people who are in poverty.
Instead, we find that most people in poverty are already working, actively seeking work, or unable to work. Let’s break down the people in poverty into groups.
A Closer Look at Poverty Groups
Think of this chart like a pie chart of the type of people in poverty broken apart. The largest group in poverty is children, accounting for almost a quarter of the population in poverty. Next are adults who are working, seniors, people with disabilities, caregivers, and students. All the way on the right is the group of able-bodied adults not working makes up just over one percent of those in poverty.
Far from being inactive, the vast majority of people in poverty are already contributing to society in essential roles-or facing barriers beyond their control.
If we think back to our definition of poverty, it can help explain why. Remember poverty is a household measure. More people in the household raise the poverty line because you need more resources to meet basic needs.
- But because the people in these groups are often unable to work. They usually don’t add any additional work income. So its common for a worker living on their own to be out of poverty, but once you consider family dependents, they sink into poverty.
- This is why, households with two workers and no dependents have a poverty rate of almost 2 percent. while households with one worker and four dependents have a poverty rate of closer to 20 percent
- The ratio of dependent to workers matters a lot.
We’ll revisit this how to address this when talking about what we can do to get people out of poverty. But I do hope this chart does for you what it did for me and change the way you think about what poverty looks like.
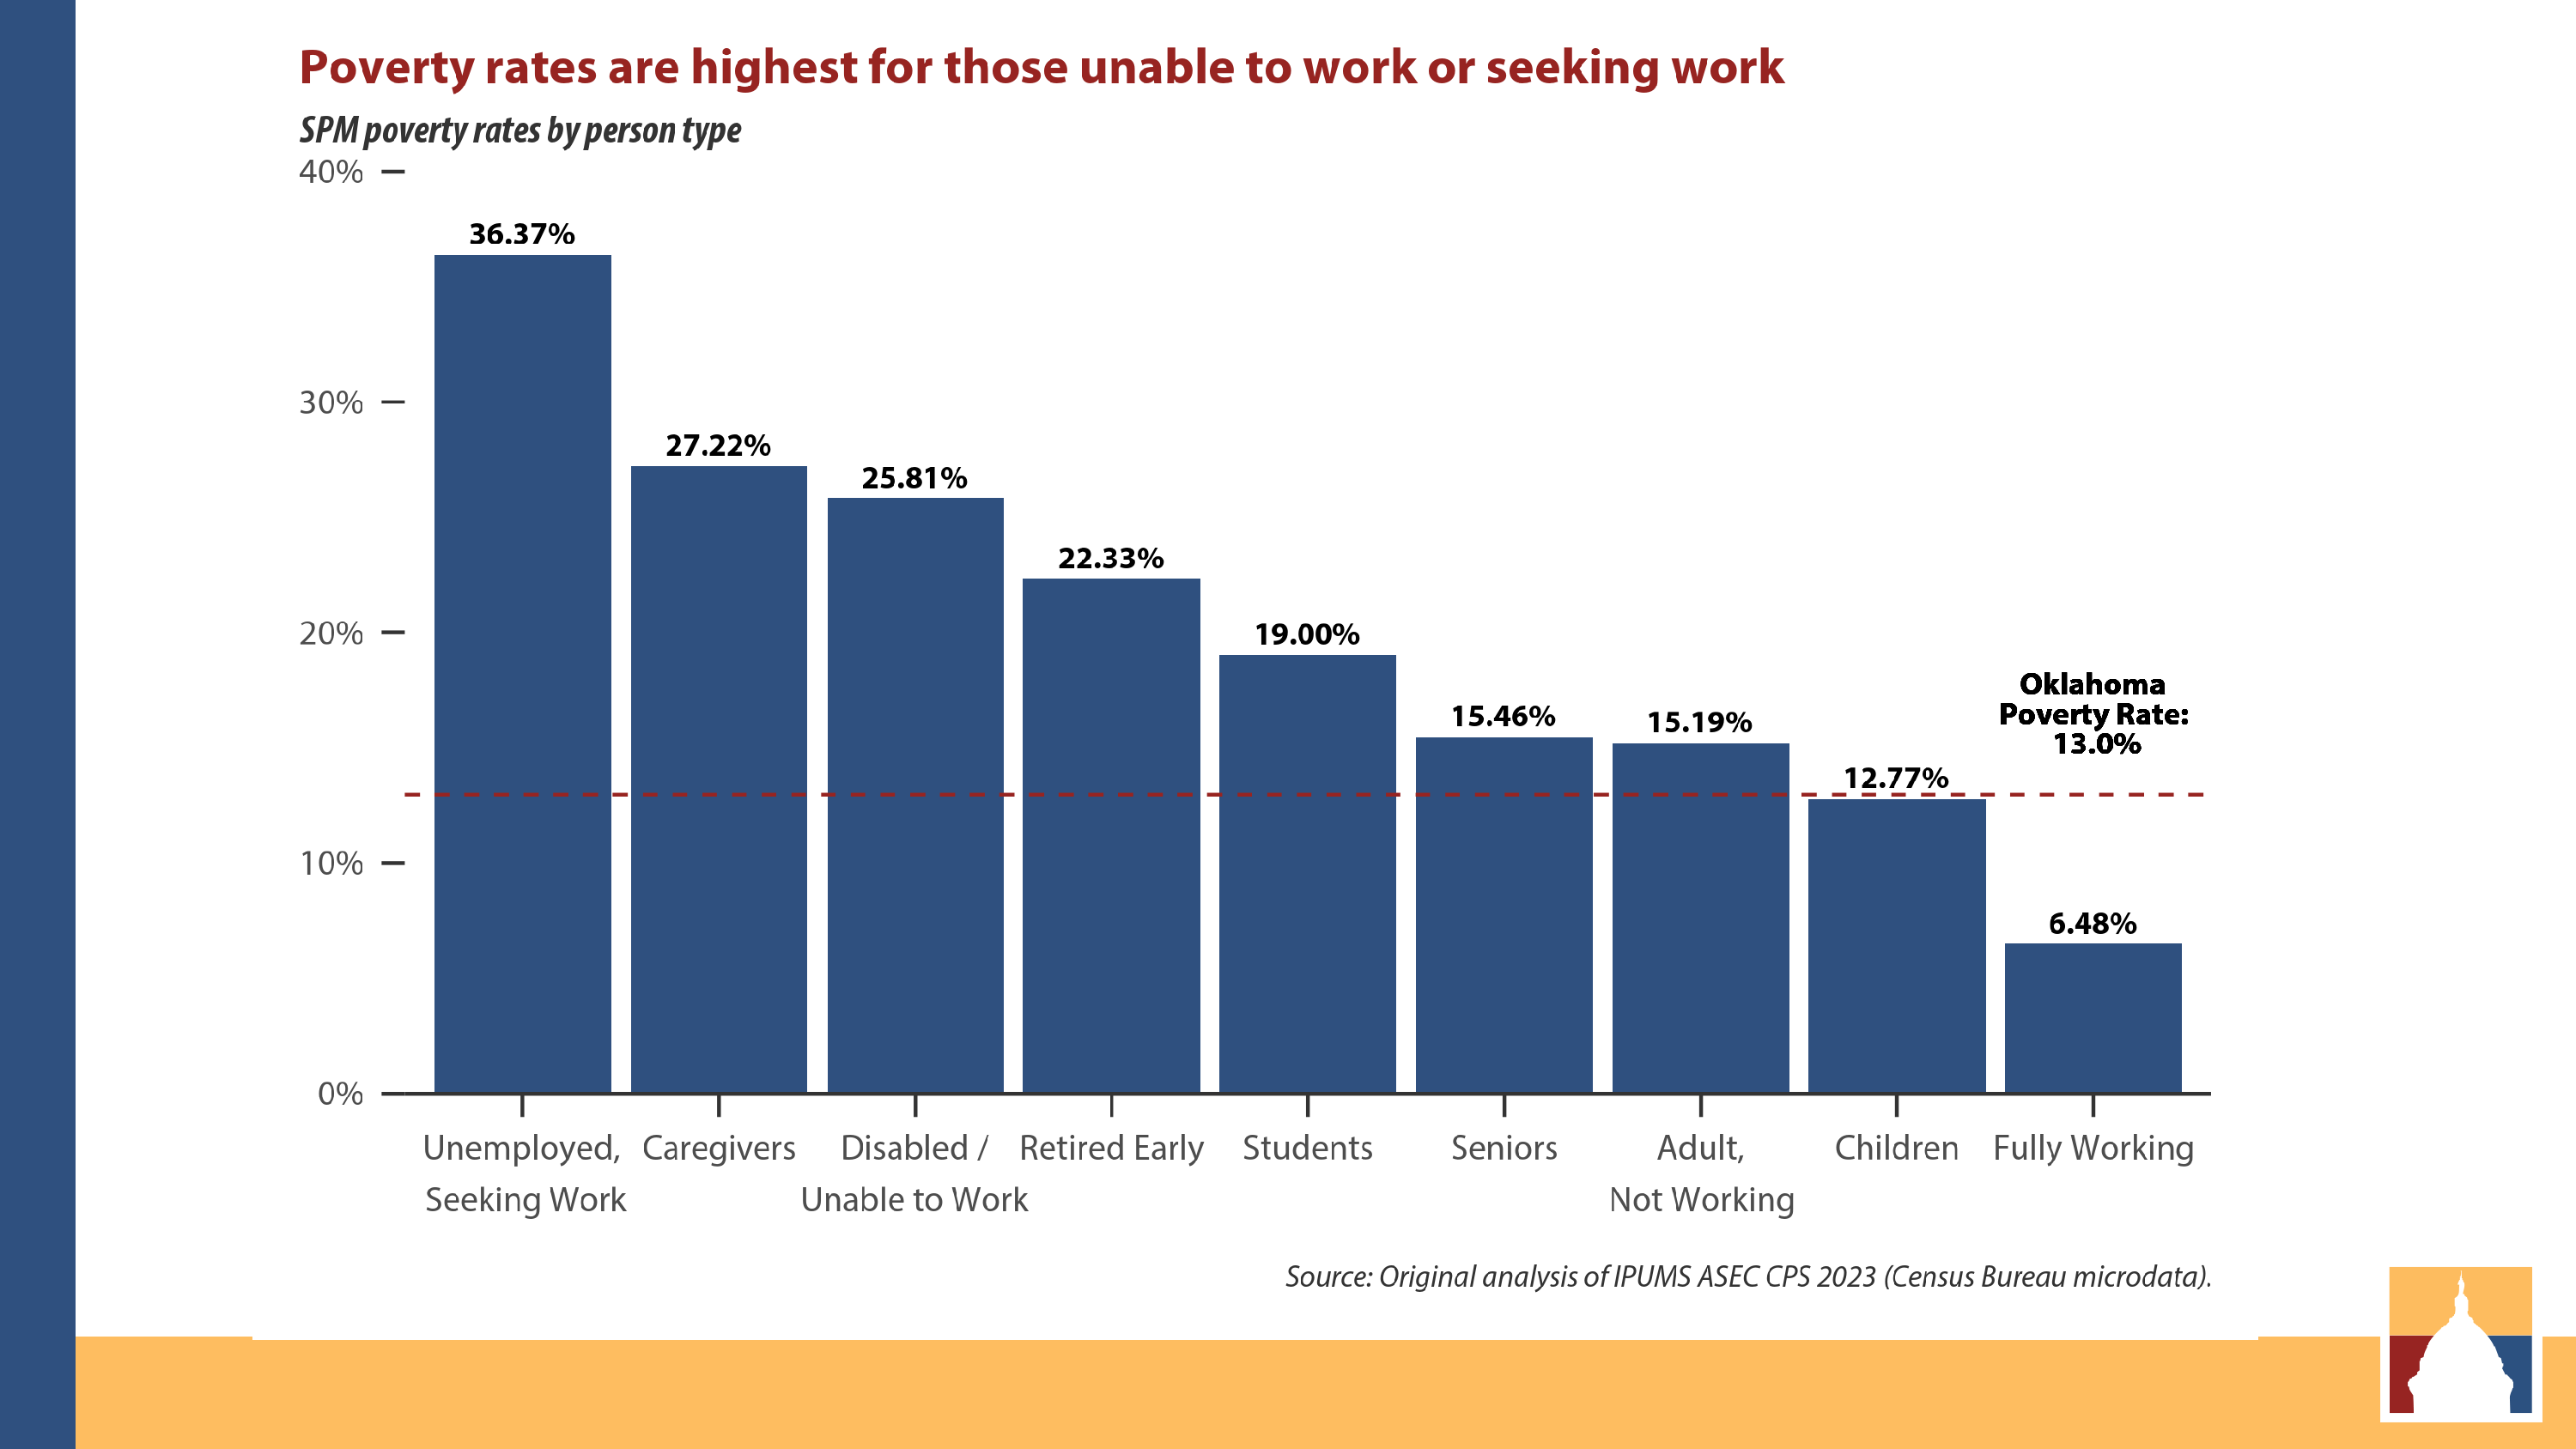
Vulnerability by Group
This slide shifts our focus to the rates of poverty within each group. We see that those most likely to be in poverty are the ones least able to work or are trying to: 36 percent of unemployed Oklahomans and 25 percent of those with disabilities live in poverty, compared to just 6.5 percent of those currently employed. This reflects a broader issue: poverty is tied to a lack of opportunity and support, not just a lack of effort.
Disparities by Race
When we break down poverty rates by race, stark disparities emerge. Black, Native American, Hispanic, and multiracial Oklahomans are more likely to live in poverty, with Black Oklahomans facing rates nearly twice that of their white counterparts. Going back to how poverty is calculated, we can see this is driven largely by differences in income, making it a critical area for intervention.
For example we saw the highest poverty rates are among the unemployed, people who are seeking work but can’t find a job who is willing to take them. In Oklahoma, the Black unemployment rate was 8 percent, 6.3 percent for Native Americans, and 3.8 percent for white people.
Educational Impact
Educational attainment is another major factor, which will be discussed at length later. Those without a high school diploma are nearly three times as likely to be in poverty as those with some college education. This highlights the importance of improving educational access and quality if we’re serious about reducing poverty.
Rural vs. Urban Poverty
Rural Oklahomans also experience higher poverty rates — 18.8 percent compared to 13 percent statewide. The SPM does adjust for the lower cost of living in rural areas, but the income gap is so large that it overshadows those adjustments.
Gender Differences
Finally, we see a small but persistent gap between men and women. Women are slightly more likely to be in poverty (13.3 percent versus 12.6 percent), driven by lower wages and higher caregiving responsibilities.
What Can We Do to Get People Out of Poverty?
With a clear picture of the problem, what are our options? In this section, I am not prescribing things we should do — only listing the options available. Again, I like to go back to our definition of poverty: Having enough resources to meet basic needs. Where resources are income plus public assistance minus expenses. So there are only three options:
- Reduce Expenses
- Increase Income
- Expand Public Assistance
Let’s briefly look at each. And you’ll notice speakers address different parts of this.
Reducing Expenses
Reducing expenses means lowering the costs of unavoidable necessities need to keep a job or stay alive, like child care, medical bills, and transportation. Programs that make these more affordable can make a substantial difference, especially for families with a large number of dependents compare to the number of workers.
Increasing Income
There are three sources of factor income but individuals in poverty often lack significant access to two of them. The first is rent through ownership of property or land. And the other is interest and profits, such as through stock ownership. These passive sources of income can be a very useful cushion to stay out of poverty.
For those in poverty who work the most significant factor income is obviously salary/wages. So, increasing income can happen through higher wages, better job opportunities, or investments in training and education.
Expanding Public Assistance
The other option is public assistance. Notice that most public assistance is often tailored to those groups mentioned we keep mentioning.
- People with a disability: Social Security Disability Insurance (SSDI)
- Children: Child Tax Credit, Earned Income Tax Credit, WIC
- Seniors: Social Security and Supplemental Security Income (SSI)
- Unemployed: Unemployment Insurance
- Caregivers: Caregiver tax credits
- Students: Pell Grants, American Opportunity Tax Credit (AOTC)
Public assistance addresses the fact that some households have many dependents and few workers. And that statistically that ensures a significant portion of them will be in poverty if not provided additional resources.
What public assistance does is spread a portion of that cost across a wider portion of society. So that households can more easily bear their responsibility. They also provide a degree of economic security in case of unexpected events for which they are not at fault. Such as an economic downturn causing sudden job loss or a family member who used to work now developing a disability. Or even just entering a new stage of life such as retirement, having to leave their job to take care of another family member, or attending college.
Finally, I should note that some programs are more generally eligible to people based on their income, such as SNAP, Medicaid, etc., and not necessarily always tailored to these groups.
The Impact of Policy Choices
This final chart shows the effects of various programs on poverty. For example, Social Security alone reduces the poverty rate by 8 percent (mainly of seniors), while medical expenses, if not addressed, increase it by 3 percent.
If we decide to pursue some of the options described today, we can empirically answer questions like what how many Oklahomans would be lifted out of poverty if we made that change.
Salaries/wages aren’t on here, but we could even estimate what would happen to poverty if we salaries increased by 10 percent by investing in education in training. Then we can compare that to the cost of that policy.
This is a powerful tool because it makes poverty more concrete and allows us to predict the impact of different policies. But there’s a distinction between us showing that statistically a policy would lift 50,000 Oklahomans out of poverty, and making the case that we should pursue that policy because it’s the right thing to do. That’s the part we leave to all of you.
