OKPOLICY.ORG


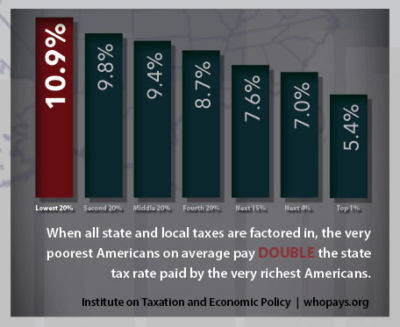 In her 2017 State of the State address, Gov. Mary Fallin called for the elimination of the state sales tax on groceries, saying that “this plan eliminates the most regressive tax on the books today.”
It’s widely accepted that taxing groceries is regressive, since grocery bills are a bigger part of the budget for low-income households than for wealthier households. But where’s the data that actually shows how much Oklahomans at different income levels pay in sales tax on groceries? And what about plans to raise the excise tax on cigarettes and motor fuels that the Governor also proposed as part of her FY 2018 budget? What would be the impact on Oklahoma households across the income spectrum if those taxes were raised? This kind of information about who pays taxes is critical for making well-informed decisions on tax policy, but it’s largely unavailable to most legislators.
A bill filed this session by freshman Representative Marcus McEntire (R-Duncan) would fill in that information gap. HB 2209 would ensure that lawmakers and the public have crucial information about the impact of tax proposals on real households. The bill directs the Oklahoma Tax Commission to prepare a biannual report — known as a tax incidence report, or distributional analysis — that determines the overall distribution of the state’s income, sales, and excise taxes by income classes. In addition, the Tax Commission would be directed to prepare a tax incidence report on any bill that increases, decreases, or redistributes income by more than $20 million, upon the request of the Chair of the committee to which the bill is assigned.
The type of tax incidence study called for in HB 2209 is already conducted in other states, including Minnesota and Texas, where the Comptroller’s Office publishes a biannual report on tax exemptions and tax incidence. From the most recent Texas report, for example, one can learn that households in the bottom income quintile pay 6.9 percent of their income in sales and excise taxes, compared to 1.6 percent for those in the top quintile, but that the highest quintile of taxpayers pay 29.6 percent of all sales and excise taxes, compared to 6.8 for those in the lowest quintile.
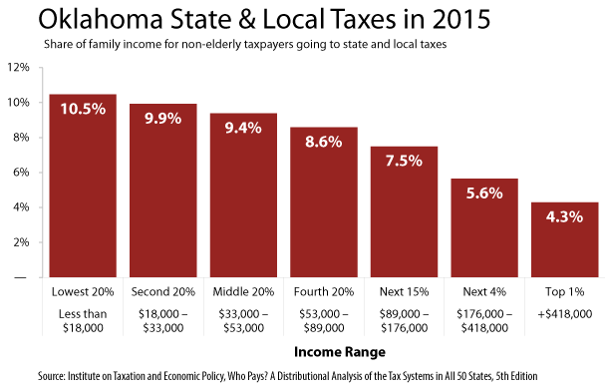
Although nobody in Oklahoma currently produces official tax incidence reports, the DC-based Institute on Taxation and Economic Policy (ITEP) operates a computer model that can generate distributional analyses of each state’s overall tax system and of specific tax proposals. ITEP’s publication, Who Pays?, A Distributional Analysis of the Tax Systems in All Fifty States, last updated in 2015, breaks down the share of their total income that Oklahomans pay in income taxes, sales and excise taxes, property taxes, and all state and local taxes combined. Over the years, ITEP has worked closely with OK Policy to provide distributional analyses of various tax proposals, such as the 2014 cut to the top income tax rate that provided just $31 to the median Oklahoma household.
Although ITEP’s model is highly-respected, they don’t analyze all major proposals being considered in Oklahoma. Oklahoma already requires that legislation include a fiscal impact statement estimating how total tax collections will be affected. Knowing who would be the winners and losers under different tax proposals is equally valuable information that should be readily and regularly available to policymakers and engaged citizens alike.