




 OKPOLICY.ORG
Chan Aaron is an OK Policy summer intern. He is pursuing an environmental policy degree at The University of Tulsa. He is also a graduate of Oklahoma State University with a degree in philosophy and a veteran of the United States Navy.

Rising income inequality has become one of the biggest concerns for U.S. and world leaders in recent years, and for good reason. As recent data from the Economic Policy Institute (EPI) shows, income inequality in the United States is near a historic high not reached since just before the Great Depression. While incomes for Oklahoma households are slightly more equal than the nation as a whole, they are still the highest they have been in the state’s 107-year history.
According to the Economic Policy Institute’s study, the average income of the top 1 percent of Oklahomans in 2012 (the most recent data) was $1,105,521, which is 26 times greater than the average income for the other 99 percent of the state ($41,995). Oklahoma’s 2012 economic disparity numbers ranked 12th highest in the nation.
What did it take to make it into the top 1 percent in Oklahoma in 2012? The income threshold for the top 1 percent was $328,072. To take it one step further, what put an Oklahomans in the top .01 percent? The income threshold for the top .01 percent was $8,371,194, and the average income was $28,439,334. Oklahoma ranked 16th highest in the entire country for average income of the top .01 percent.
These levels of inequality aren’t unique to 2012; however, they are part of a trend that reached its apex at the end of the first four years of recovery following the Great Recession. From 2009 to 2012, overall state income grew by 9.4 percent. However, income for the top earners grew markedly faster (39.6 percent) than the bottom earners (3.5 percent). The top 1 percent captured more than half (69.2 percent) of total growth during the important four-year period of economic recovery.
This outsize share of income growth going to the already-wealthy is part of a larger trend beginning over thirty years ago. Between 1979 and 2012, the top 1 percent’s income grew by a staggering 143.2 percent while they captured 67.9 percent of all Oklahoma growth. Incomes for the entire rest of the state grew by just 8.0 percent during the same period.
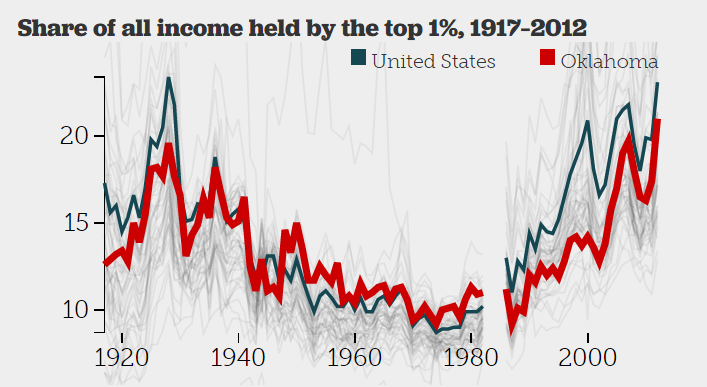
As the graph shows clearly, income inequality peaked in 1928 then declined rapidly in the 1930s and 1940s and then more moderately late into the 1970s. Beginning in the early 1980s, the share of income held by the top 1 percent ratcheted up with a few scattered decreases. The overall tendency for the last three and a half decades has been for inequality to go sharply upward. As of 2012, Oklahoma finds itself with the largest economic disparity in its entire history.
If the richest Oklahomans have been getting the most benefit from economic trends over the last 35 years, then why do our state legislators continue to approve tax cuts that mostly go to the wealthy while cutting funding for education, public safety, and other core services? When the state cuts funding to public services, the wealthy are hurt least, and low- and middle-income families bear the brunt of the burden. There’s also strong evidence that extreme inequality reduces overall growth, so wealthy and poor alike end up less well off than we could have been if prosperity was more broadly shared. With an economy that is still leaving many families behind, isn’t that just piling on?